Welcome to
 The business problem
Item explorer is an approach to provide insights into a ubiquitous class of business questions like:
- what kind of products do customers typically buy together?
- what kind of web pages (on a web site) do users visit?
- what combination of symptoms do patients have?
- ...
For this class of business questions, the exponential number of combinations poses a severe practical challenge. Due to the explorative nature, visualization is well-suited for such business questions. More specifically, a visualization can provide a unique representation for both revealing insights and for intuitive user interaction based on business knowledge or own hypotheses.
 An example
Let's consider a grocery store which tries to understand the shopping patterns of customers. In theory, a store selling n different products can observe 2n-1 different shopping patterns! To make it more manageable, we consider a higher level of abstraction, namely 20 different product categories, such as eggs, cereal, candy, etc. Still, there are 220-1 ≅ 1 million possible shopping patterns:
- customer A buys eggs
- customer B buys candy
- customer C buys eggs and cereal
- customer D buys eggs, candy and cereal
- ...
 Limitations of current approaches
For this setting there are three obvious approaches to start with, however, each comes with its limitations:
- Count all patterns, sort it and output the top most patterns. This is surely a good starting point. However, it returns just the tip of the iceberg and doesn't give you much insight beyond that.
- Create a pivot table from the data. With a pivot table you have a flexible way to search within that combinatorial space. Filtering on the inclusion/ exclusion of product categories is possible for retrieving a specific product combination. However, it is not well suited for interactively exploring the space of product category combinations.
- The data mining community came up with algorithms to discover association rules for this kind of setting. But it is hard to specify the parameters and even then, the result set might still be very large. Thus additional exploration techniques have to be applied.
 The new approach: item explorer
The basic idea of item explorer is to visualize the product categories in an intuitive way and to allow the user to interactively explore the combinatorial space. The choice of the underlying visualization is the good old bar chart! Huh, why that? The decision in favour of the most widely applied, old-fashioned visualization comes from the fact, that the cognitive ease and intuition to read and quantitatively interpret bar charts is still unmatched. Yes, let's go back to the very basics ... but at the same time let's push the envelope to accompany the visualization with rich and meaningful interactions without sacrificing the ease of use and interpretation.
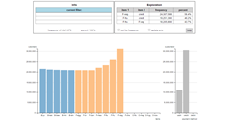
Item explorer represents each item/ product category by a bar in the bar chart. Following the example above, each bar denotes the number of customers buying that specific product - independent of all other products. E.g. a bar referring to candy denotes the number of customers who bought candy no matter what they bought in addition. This means each bar has a clear meaning but customers who bought more than one product are contributing to the frequency of all bars of the corresponding products.
The interactive exploration is supported in two ways:
- Automated guidance (by number crunching in the background): At any time, for the currently selected customer set, the most frequent two-product combinations are displayed in the exploration panel. This helps the user to automatically detect patterns most useful given her exploration intention.
- User driven interaction:
The user can click on individual bars to interactively transition the visualization to the subset of customers
meeting certain conditions. Through letting the user interact with the chart, she is able to steer
the exploration based on her domain knowledge in conjunction with ad-hoc hypotheses popping up when
looking at the bar chart. The following conditions can be chosen:
- having a product AND
- having a product OR
- NOT having a product
Feel free to jump right to the links to a demo, a video, and the source code on github.